A drop in black turnout hurt Clinton. An uptick in white turnout helped Trump. From the Census:
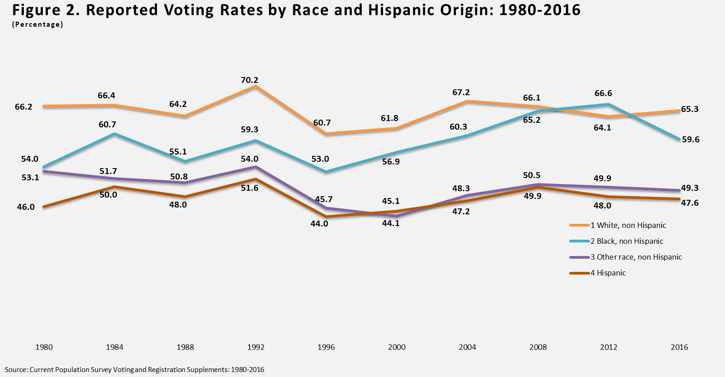
Voting rates have historically varied by race and Hispanic origin (Figure 2). In 2012, voting rates for non-Hispanic blacks (66.6 percent) were higher than non-Hispanic whites (64.1 percent) for the first time in this series. In 2016, turnout increased to 65.3 percent for non-Hispanic whites, but decreased to 59.6 percent for non-Hispanic blacks.
For the most part, from 1980 to 2012, the share of reported voters who were non-Hispanic white decreased from one presidential election cycle to the next (Figure 3).1 In 1980, 87.6 percent of reported voters were non-Hispanic white, but by 2012, this number decreased to 73.7 percent. Over this same period, the distribution of voters who reported being either non-white or Hispanic increased in most elections.2 However, in 2016, for only the second time in this series, the percentage of voters who were non-Hispanic white (73.3) was not statistically different from the previous presidential election, meaning that the consistently observed year-to-year decrease did not occur in this most recent cycle. Additionally, 2016 was only the second election in this series where the share of non-Hispanic black voters decreased, from 12.9 percent in 2012 to 11.9 percent in 2016.3
