At RealClearPolitics, David Byler explains why the Hispanic vote is not going to have much impact on the 2014 House elections: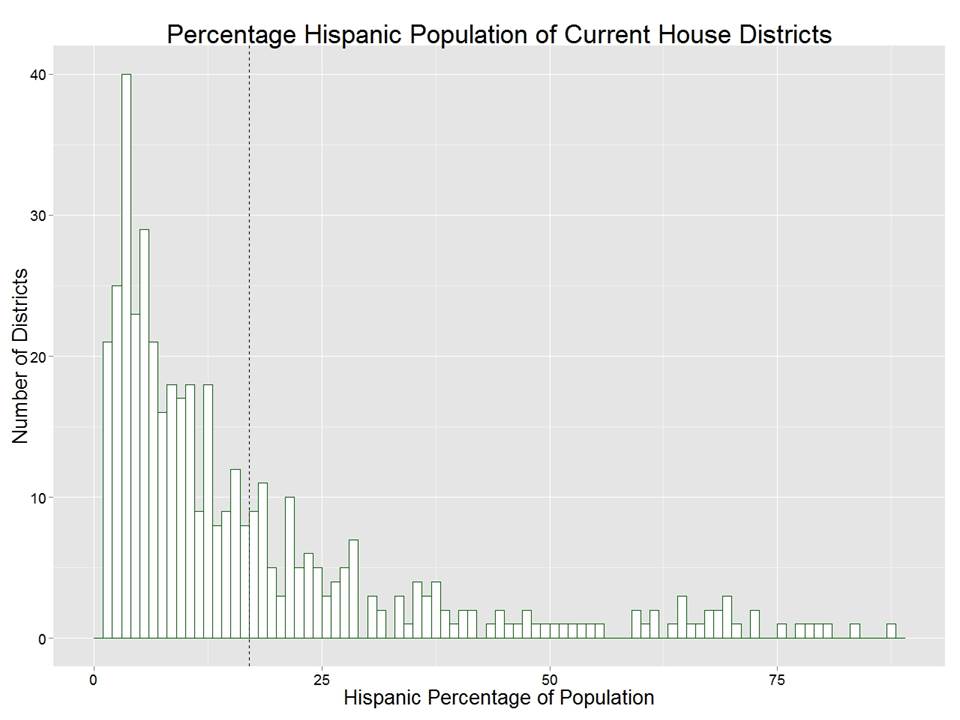
The histogram above summarizes the situation using data from the American Community Survey. There are quite a few tall bins to the left of the dotted line (representing the mean) and the bins to the right of the dotted line are spread across a large range of values. For those unfamiliar with histograms, this means that a large number of congressional districts have a below-national-average percentage of Hispanics while a few districts have large Latino populations.
Put another way, almost half of all House members hail from districts where less than one in 10 citizens is Hispanic (the estimated national average is 17.1 percent). Roughly two-thirds of the members come from districts where the percentage of Hispanics is lower than the national average.
In other words, congressional districts are constructed such that most incumbents running for re-election do not have to worry much about earning Latino votes.