Search This Blog

Showing posts with label party idenification. Show all posts

Wednesday, August 20, 2025

D Registration Decline


 Shane Goldmacher with Jonah Smith at NYT:
The Democratic Party is hemorrhaging voters long before they even go to the polls.

Of the 30 states that track voter registration by political party, Democrats lost ground to Republicans in every single one between the 2020 and 2024 elections — and often by a lot.

That four-year swing toward the Republicans adds up to 4.5 million voters, a deep political hole that could take years for Democrats to climb out from.
The stampede away from the Democratic Party is occurring in battleground states, the bluest states and the reddest states, too, according to a new analysis of voter registration data by The New York Times. The analysis used voter registration data compiled by L2, a nonpartisan data firm. 


Sunday, November 3, 2024

The Weighting Game

 In Defying the Odds, we talk about the social and economic divides that enabled Trump to enter the White House. In Divided We Stand, we discuss how these divides played out in 2020.  In both elections, however, polls tended to overstate Democratic margins. 

 Josh Clinton at Good Authority:
Many pollsters now worry whether survey respondents are too Democratic-leaning relative to the electorate. In this survey, 40% of the respondents identify as Democrats and 31% identify as Republicans, even after weighting the data to match the demographics of the 2020 electorate.

But it’s not clear whether this Democratic-leaning sample is a problem. It does not match some other polls, which suggest a narrower party divide. But if Democrats end up being more mobilized to vote in 2024, this partisan imbalance could be a feature of this year’s electorate.

Or maybe not. It could be that Democratic voters are just more likely to take this poll – as was the case in 2020.

If it’s the latter, then the sample is “too Democratic” and needs to be adjusted further. Two common approaches are to weight the sample by partisanship or by self-reported vote in the last presidential election. But again, the right benchmark isn’t obvious.

For partisanship, pollsters often rely on benchmarks such as the Pew Research Center’s National Public Opinion Research Sample, which suggests that the country is evenly split – 33% Democrat, 32% Republican, and 35% independent – or Gallup’s tracking survey, which suggests that 28% are Democrats, 31% are Republicans and 41% are independents. If I adjust the raw data by both the demographics of the 2020 electorate and these party identification benchmarks, Harris’ margin is greatly reduced relative to the raw data and demographics alone:


Raw data: +6.0 Harris
2020 demographics: +9.0
2020 demographics + Pew party identification: +3.9
2020 demographics + Gallup party identification:+0.9

Wednesday, April 10, 2024

Divided, Indeed

 In Defying the Odds, we talk about the social and economic divides that enabled Trump to enter the White House. In Divided We Stand, we discuss how these divides played out in 2020.    It is the "coalition of the ascendant" v. "the coalition of the resentful.

From Pew:

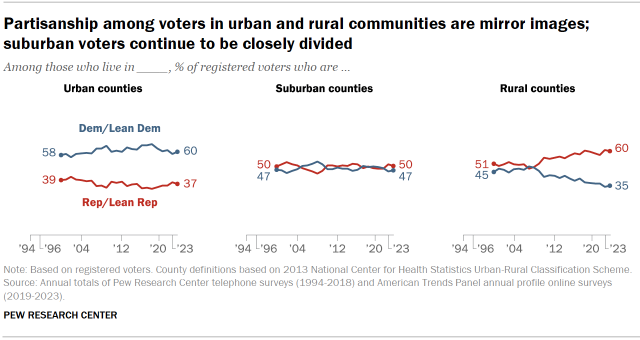
The rural - urban divide


Friday, July 29, 2022

Democratic Party Demographic Profile

 In Defying the Odds, we talk about the social and economic divides that enabled Trump to enter the White House. In Divided We Stand, we discuss how these divides played out in 2020.

Daniel A. Cox at the Survey Center on American Life:

Surveys have found little change in the number of Democrats in the adult public. Roughly one in three Americans identify as Democratic today (and about one in four are Republican)—numbers that have been fairly constant since the mid-1990s.[iii]

But the stable size of Democratic Party membership among the public belies large changes in its composition. Over the past 20 years, while the balance of Democrats and Republicans among the public has remained much the same, the Democratic Party’s demographic profile has undergone a remarkable transformation. Today, the party is more racially and ethnically diverse, includes a larger share of college-educated adults, and has more people who self-identify as liberal. It also includes far fewer religious people.

...

A record number of Americans are graduating from college. In 2021, the number of Americans 25 and older who hold a bachelor’s degree rose to 38 percent from 30 percent only a decade earlier.[xv]

Today, college-educated Americans are overrepresented in the Democratic Party (Figure 6). Nearly half (48 percent) of Democrats over age 24 have a degree from a four-year college or university, and nearly one in four (23 percent) have a postgraduate degree.[xvi] In 1998, only 23 percent of Democrats had a college or postgraduate degree.[xvii]

The Republican Party has not experienced similar growth among those with a college education. In 2021, fewer than one in three (31 percent) Republicans had a college education, nearly identical to the number (30 percent) who had a degree in 1998.

Sunday, June 12, 2022

California: Still Bad for Republicans

Our book is titled Divided We Stand: The 2020 Elections and American Politics.  Among other things, it discusses state and congressional elections

 Emily Hoeven at CalMatters:

Only three days have passed since California’s primary election, and at least 2.8 million ballots still have to be counted, local elections offices said Thursday. And it isn’t yet clear in four statewide and numerous congressional and legislative races which two candidates will advance to the general election in November.

Nevertheless, some key takeaways have started to come into focus, four of California’s top political experts said Thursday during an election post-mortem hosted by the Sacramento Press Club.

Here are some points that stood out to me during the hour-long discussion:
  • One reason why it may be so difficult for no-party-preference candidates to gain traction — as evinced by the performances of Michael Shellenberger in the governor’s race and of Anne Marie Schubert in the attorney general’s race — is that no-party-preference voters often do, in fact, prefer one party over another. “There’s this overwhelming assumption that continues to persist that all people who are NPP voters are somehow in the middle, they’re all somehow between Republicans and Democrats,” said Republican political strategist Matt Rexroad. “And that’s just not true.” Indeed, a 2021 Public Policy Institute of California survey found that 52% of likely independent voters lean Democratic, while 36% lean Republican. As of May 23, around 47% of California voters were registered Democrats, compared to 24% Republicans and 23% no party preference.
  • As shown by the numbers above, any Republican running for statewide office in California faces a formidable foe: math. So, although independent expenditure groups backing Democratic Attorney General Rob Bonta sought to catapult his Trump-aligned opponent Eric Early into the November general election over the more moderate Nathan Hochman, “we didn’t care what Republican we got” in November, said Bonta campaign consultant Dana Williamson. And, although Republican controller candidate Lanhee Chen may have secured more votes than his four Democratic opponents in the primary, he will mathematically face an uphill battle in November when he squares off against just one Democrat, CalMatters’ Sameea Kamal reports.

Monday, January 17, 2022

Shift in Party ID


Jeffrey M. Jones at Gallup:
On average, Americans' political party preferences in 2021 looked similar to prior years, with slightly more U.S. adults identifying as Democrats or leaning Democratic (46%) than identified as Republicans or leaned Republican (43%).

However, the general stability for the full-year average obscures a dramatic shift over the course of 2021, from a nine-percentage-point Democratic advantage in the first quarter to a rare five-point Republican edge in the fourth quarter.

 In the first quarter of 2021, 49% of U.S. adults identified as Democrats or leaned Democratic, while 40% identified as Republicans or leaned Republican. In the second quarter, 49% were Democrats or Democratic leaners, and 43% were Republicans and Republican leaners. In the third quarter, 45% were Democrats and Democratic leaners, and were 44% Republicans and Republican leaners. In the fourth quarter, 42% were Democrats and Democratic leaners, and 47% were Republicans and Republican leaners.

These results are based on aggregated data from all U.S. Gallup telephone surveys in 2021, which included interviews with more than 12,000 randomly sampled U.S. adults.


Cookie Settings

Please select the cookies you want for the best website experience.


Tuesday, May 4, 2021

Partisan Bubbles

Our new book is titled Divided We Stand: The 2020 Elections and American Politics.  Among other things, it discusses Trump's legacy.

Gus Wezerek, Ryan D. Enos and Jacob Brown at NYT:
More than half of Republicans believe that last year’s election was stolen from Donald Trump. Rather than reject claims of election fraud, Republican lawmakers have used the premise that the election was stolen to justify restrictions on voting.

Mr. Trump most likely deserves much of the blame for the widespread belief among Republicans that the election was illegitimate. But there’s another reason so many Republicans might not believe that Joe Biden won: They don’t live near people who voted for him.

Surveys have shown that Americans’ animosity toward the opposing political party is higher than it has been in decades. At the same time, we’ve found that geographic political segregation has increased over the past 10 years. Could the two trends be connected?

“It’s a lot easier to demonize people on the other end of the political spectrum if you don’t personally know many of them,” said Richard D. Kahlenberg, a senior fellow at the Century Foundation. “That’s not a healthy situation for the country.”

Earlier this year, we published a study that measured how politically isolated Democrats and Republicans have become. Starting with a dataset containing the address of nearly every registered voter in the United States, we estimated each voter’s political affiliation based on which party the voter registered with, demographics and election results. We used that data to create the maps here.

We measured political isolation by looking at each voter’s thousand closest neighbors. For about one in five Republicans, and two in five Democrats, less than a quarter of their neighbors belong to the opposite political party.

Saturday, June 13, 2020

Party Coalitions

In Defying the Odds, we talk about the social and economic divides that enabled Trump to enter the White House.

Pew reports on party identification:
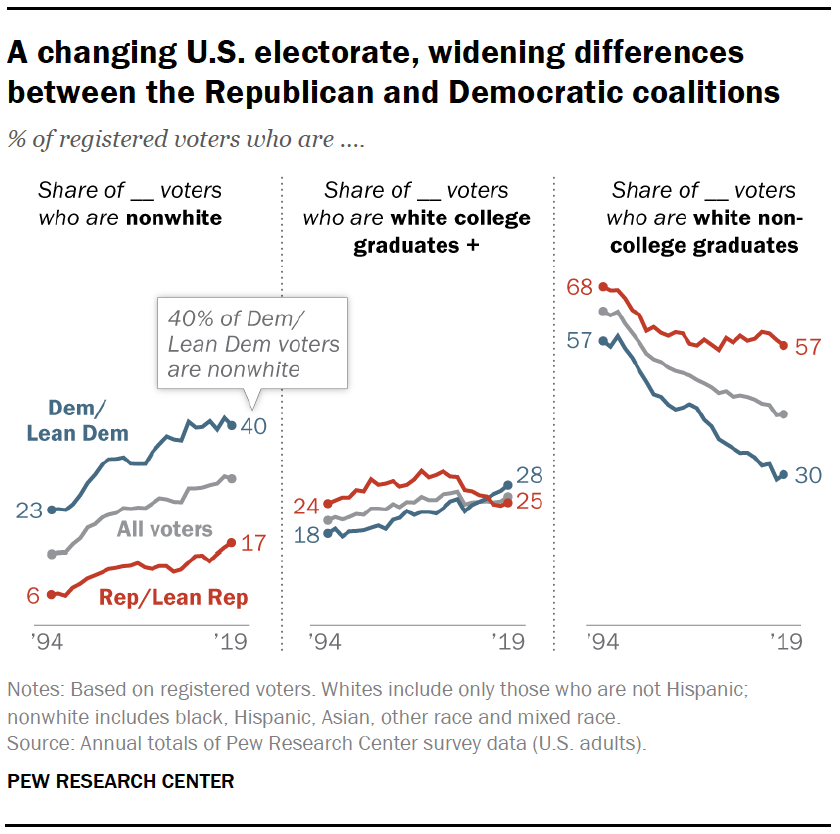
White non-Hispanic voters continue to identify with the Republican Party or lean Republican by a sizable margin (53% to 42%). Yet white voters constitute a diminished share of the electorate – from 85% in 1996 to 69% in 2018/2019. And the growing racial and ethnic diversity of the overall electorate has resulted in a more substantial change in the composition of the Democratic Party than in the GOP: Four-in-ten Democratic registered voters are now nonwhite (black, Hispanic, Asian and other nonwhite racial groups), compared with 17% of the GOP.
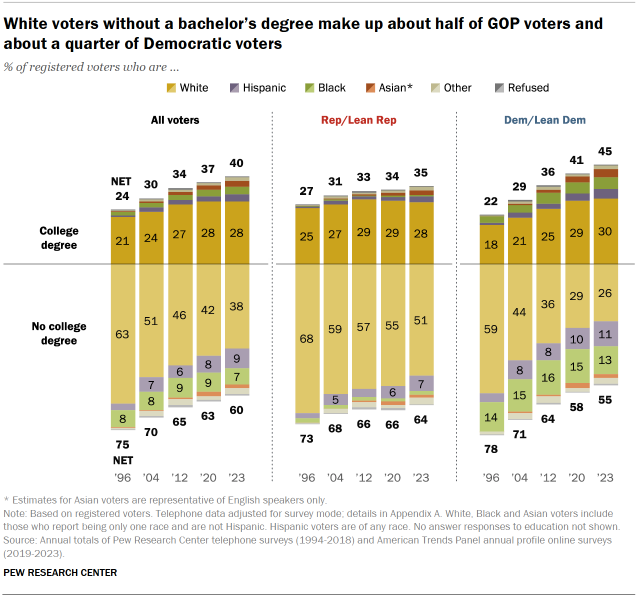
Just as the nation has become more racially and ethnically diverse, it also has become better educated. Still, just 36% of registered voters have a four-year college degree or more education; a sizable majority (64%) have not completed college. Democrats increasingly dominate in party identification among white college graduates – and maintain wide and long-standing advantages among black, Hispanic and Asian American voters. Republicans increasingly dominate in party affiliation among white non-college voters, who continue to make up a majority (57%) of all GOP voters.
 A changing U.S. electorate, widening differences between the Republican and Democratic coalitions

Tuesday, January 7, 2020

Dems Keep Lead in Party Identification

In Defying the Odds, we discuss demographic and partisan gaps in the 2016 election.

Jeffrey M. Jones at Gallup:
In 2019, on average, 47% of U.S. adults identified politically as Democrats or said they were independents who leaned toward the Democratic Party. Meanwhile, 42% identified as Republicans or were Republican-leaning independents.
Americans' political leanings have been quite stable since 2016, the year Donald Trump was elected president. The Democratic figure has not changed in the past four years, and the Republican figure has been 41% or 42% each year since 2012.

The latest results are based on aggregated data across all Gallup Poll surveys in 2019, which include interviews with more than 29,000 U.S. adults.

Tuesday, April 23, 2019

College Whites and Noncollege Whites

In Defying the Odds, we discuss social divides of the 2016 electiion. The update -- just published --includes a chapter on the 2018 midterms.

White Americans without college degrees helped propel Donald Trump to an upset victory in the 2016 election and have been one of his most supportive subgroups during his presidency. The group's support for Trump may largely reflect their political leanings as much as their affinity for Trump, as currently, 59% of non-college whites identify as Republicans or say they are independents who lean toward the Republican Party.

But non-college-educated whites were firmly aligned with the GOP well before Trump announced his presidential candidacy on June 16, 2015. In 2014, 54% of whites without college degrees identified as Republicans or were Republican-leaning independents, compared with 34% who were Democrats or Democratic leaners.
In fact, white college nongraduates have preferred the GOP to the Democratic Party for most of the past two decades, with at least a slight Republican advantage in affiliation for 15 of the past 20 years.
...

.At the same time that non-college whites' attachment to the GOP has grown, there has been a shift in the political allegiance of whites with college degrees toward the Democratic Party. Since the 2016 presidential election year, white college graduates have gone from being evenly divided in their political preferences to preferring the Democratic Party by double-digit margins in 2018 (52% to 42%) and 2019 (54% to 41%).

Thursday, March 22, 2018

Party Composition

In Defying the Odds, we discuss the demographic divides of the 2016 campaign.

Pew has analyzed party affiliation data from 2017.
Record share of college graduates align with Democrats. Voters who have completed college make up a third of all registered voters. And a majority of all voters with at least a four-year college degree (58%) now identify as Democrats or lean Democratic, the highest share dating back to 1992. Just 36% affiliate with the Republican Party or lean toward the GOP. The much larger group of voters who do not have a four-year degree is more evenly divided in partisan affiliation. And voters with no college experience have been moving toward the GOP: 47% identify with or lean toward the Republican Party, up from 42% in 2014.
Continued racial divisions in partisan identification. About half of white voters (51%) identify with the GOP or lean Republican, while 43% identify as Democrats or lean Democratic. These figures are little changed from recent years. By contrast, African American voters continue to affiliate with the Democratic Party or lean Democratic by an overwhelming margin (84% Democrat to 8% Republican). Hispanic voters align with the Democrats by greater than two-to-one (63% to 28%), while Asian American voters also largely identify as Democrats or lean Democratic (65% Democrat, 27% Republican).
Larger differences among whites by education. Most white voters with at least a four-year college degree (53%) affiliate with the Democratic Party or lean Democratic; 42% identify as Republicans or lean Republican. As recently as two years ago, leaned partisan identification among white college graduates was split (47% Democrat, 47% Republican). Majorities of white voters with some college experience but who do not have a degree (55%) and those with no college experience (58%) continue to identify as Republicans or lean Republican.
Millennials, especially Millennial women, tilt more Democratic. As noted in our recent report on generations and politics, Millennial voters are more likely than older generations to affiliate with the Democratic Party or lean Democratic. Nearly six-in-ten Millennials (59%) affiliate with the Democratic Party or lean Democratic, compared with about half of Gen Xers and Boomers (48% each) and 43% of voters in the Silent Generation. A growing majority of Millennial women (70%) affiliate with the Democratic Party or lean Democratic; four years ago, 56% of Millennial women did so. About half of Millennial men (49%) align with the Democratic Party, little changed in recent years. The gender gap in leaned party identification among Millennials is wider than among older generations.

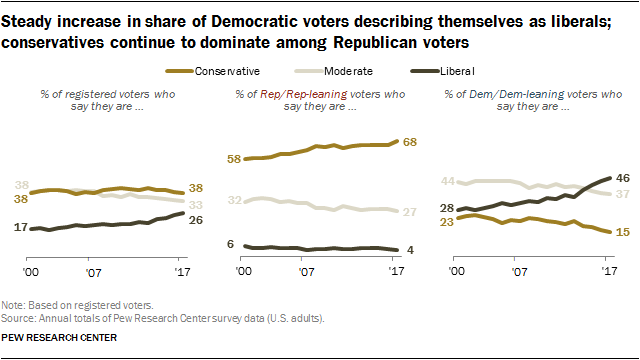
Democrats are rapidly shifting left.  Republicans have long been on the right.


As we note in the book, non-college whites once accounted for a majority of  Democrats.  Now they are only one-third:


Sunday, May 14, 2017

Trump and the White Working Class

In Defying the Odds, we discuss Trump's role in American political history.

The Public Religion Research Institute has a new study on the white working class and support for Trump in 2016. The executive summary.
Perhaps the most contested question from the 2016 presidential election is what factors motivated white working-class voters to support Donald Trump over Hillary Clinton by a margin of roughly two to one. New analysis by PRRI and The Atlantic, based on surveys conducted before and after the 2016 election, developed a model to test a variety of potential factors influencing support for Trump among white working-class voters. The model identifies five significant independent predictors of support for Trump among white working-class voters. No other factors were significant at conventional levels.
Overall, the model demonstrates that besides partisanship, fears about immigrants and cultural displacement were more powerful factors than economic concerns in predicting support for Trump among white working-class voters. Moreover, the effects of economic concerns were complex—with economic fatalism predicting support for Trump, but economic hardship predicting support for Clinton.
  1. Identification with the Republican Party. Identifying as Republican, not surprisingly, was strongly predictive of Trump support. White working-class voters who identified as Republican were 11 times more likely to support Trump than those who did not identify as Republican. No other demographic attribute was significant.
  2. Fears about cultural displacement. White working-class voters who say they often feel like a stranger in their own land and who believe the U.S. needs protecting against foreign influence were 3.5 times more likely to favor Trump than those who did not share these concerns.
  3. Support for deporting immigrants living in the country illegally. White working-class voters who favored deporting immigrants living in the country illegally were 3.3 times more likely to express a preference for Trump than those who did not.
  4. Economic fatalism. White working-class voters who said that college education is a gamble were almost twice as likely to express a preference for Trump as those who said it was an important investment in the future.
  5. Economic hardship. Notably, while only marginally significant at conventional levels (P<0 .1="" a="" actually="" americans="" among="" being="" clinton="" fair="" financial="" for="" hillary="" href="http://www.epicjourney2008.com/2016/09/trump-and-buchanan.html" in="" or="" poor="" predicted="" rather="" shape="" support="" than="" white="" working-class="">Donald Trump
. Those who reported being in fair or poor financial shape were 1.7 times more likely to support Clinton, compared to those who were in better financial shape.It is notable that many attitudes and attributes identified as possible explanations for Trump’s support among white working-class voters were not significant independent predictors. Gender, age, region, and religious affiliation were not significant demographic factors in the model. Views about gender roles and attitudes about race were also not significant. It is also notable that neither measure of civic engagement—attendance at civic events or religious services—proved to be a significant independent predictor of support for Trump.
The report also provides an in-depth profile of white working-class Americans, along with analysis of this group’s world view, outlook, and attitudes about cultural change and policy:
  • Nearly two-thirds (65%) of white working-class Americans believe American culture and way of life has deteriorated since the 1950s.
  • Nearly half (48%) of white working-class Americans say, “things have changed so much that I often feel like a stranger in my own country.”
  • Nearly seven in ten (68%) white working-class Americans believe the American way of life needs to be protected from foreign influence. In contrast, fewer than half (44%) of white college-educated Americans express this view.
  • Nearly seven in ten (68%) white working-class Americans—along with a majority (55%) of the public overall—believe the U.S. is in danger of losing its culture and identity.
  • More than six in ten (62%) white working-class Americans believe the growing number of newcomers from other countries threatens American culture, while three in ten (30%) say these newcomers strengthen society.
  • Nearly six in ten (59%) white working-class Americans believe immigrants living in the country illegally should be allowed to become citizens provided they meet certain requirements, while 10% say they should be allowed to become permanent legal residents. More than one in four (27%) say we should identify and deport illegal immigrants. Notably, support for a path to citizenship is only slightly lower than support among the general public (63%).
  • More than half (52%) of white working-class Americans believe discrimination against whites has become as big a problem as discrimination against blacks and other minorities, while 70% of white college-educated Americans disagree.
  • Fewer than four in ten white working-class Americans report they are in excellent (5%) or good shape (33%) financially, compared to six in ten who say they are in fair (35%) or poor shape (25%). White working-class Americans about as likely to say their financial situation has diminished (27%) as they are to say it has improved (29%). White college-educated Americans, in contrast, are about three times as likely to say their financial circumstances have gotten better than gotten worse (41% vs. 14%, respectively).
  • A majority (54%) of the white working class view getting a college education as a risky gamble, while only 44% say it is a smart investment.
  • Six in ten (60%) white working-class Americans, compared to only 32% of white college-educated Americans say because things have gotten so far off track, we need a strong leader who is willing to break the rules.

Thursday, December 3, 2015

Party Preference

So far, the GOP nomination contest hasn't cut into party affiliation.  Gallup reports:
Americans' party preferences are closely divided, with 43% identifying as Democrats or leaning Democratic and 41% identifying as Republicans or leaning Republican. The parties have been essentially tied since August, representing a shift from months prior when Democrats had the party affiliation advantage.

Friday, April 17, 2015

Republicans and Party Identification

Charles Cook writes at National Journal:
Focusing exclusively on the initial party identification offered by survey respondents, Republicans are in decline, with Democrats holding relatively steady and independents growing fast. That would not be good news for the GOP, although it does suggest increased volatility. Or, if you focus more on the leaned party identification, the situation is very steady, but it still does not bode well for Republicans in 2016. Leaned party identification is a reliable indicator of how people will vote, at least in a large-turnout presidential election (not so much in midterm years, when the electorate is significantly older, whiter, and more Republican.)
All of this suggests that the widely discussed concerns about the shape of the GOP brand are well founded. "Looking at the national numbers," says Fred Yang, the Democratic half of the NBC News / Wall Street Journal polling duo, "you sure wouldn't know that Republicans just won a big election."

Friday, February 6, 2015

Party ID in the States: From Blue to Red

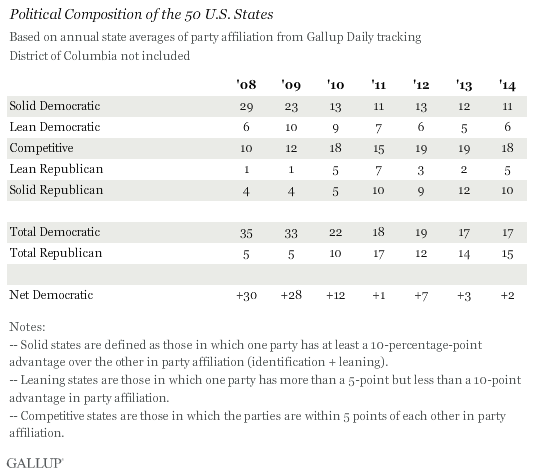
There are similar numbers of states in each of the major categories, including 17 solid or leaning Democratic states, 15 that are solid or leaning Republican and 18 that are competitive. Those totals have been fairly consistent since 2011 -- but continue to mark a major shift away from the Democratic Party since 2008, the apex for Democratic strength nationally in the last 25 years. That year, Gallup classified 29 states as solidly Democratic and an additional six as leaning Democratic, to only five solid or leaning Republican.
Political Composition of the 50 U.S. States

Wednesday, December 17, 2014

The Coda to the Democrats' Drubbing

Sean Sullivan reports at The Washington Post:
Republicans clinched their 247th U.S. House seat on Wednesday when GOP challenger Martha McSally officially unseated Rep. Ron Barber (D-Ariz.), bringing to an end the final unresolved congressional election of the midterms and handing the GOP its largest majority in the chamber since the Great Depression.
McSally's narrow win, which came after a recount, means that House Republicans will begin the 114th Congress with a 247-188 advantage over Democrats. It is the largest GOP majority since Republicans claimed 270 seats in the 1928 election.
Gary Langer writes at ABC:
The number of Americans identifying themselves as Democrats has dropped to a record low in nearly 34 years of ABC News/Washington Post polls, marking the party’s challenges after its poor showing in the 2014 midterm elections. The Republican Party, by contrast, has gained sharply in popularity, if not allegiance.
Just 26 percent of Americans now identify themselves as Democrats, down from 32 percent six weeks ago to the fewest since ABC/Post polling began in 1981.
See PDF with full results, charts and tables here.
The GOP has not benefitted in terms of direct allegiance: Twenty-three percent of Americans describe themselves as Republicans, essentially unchanged from recent levels. Instead 41 percent say they’re independents, extending a six-year run as the dominant choice.
But the GOP has gained in other gauges. Forty-seven percent see it favorably overall, up by a remarkable 14 percentage points since mid-October to its best among the general public since March 2006. Forty-four percent rate the Democrats favorably – also up since the heat of the midterm elections has eased, but just by 5 points. The Republican Party’s numerical advantage in this basic measure of popularity is its first since 2002.
The Republicans in Congress, moreover, lead Barack Obama by 47-38 percent in trust to handle the economy, a clear GOP advantage on this central issue for the first time in his presidency.

Friday, December 5, 2014

GOP Edge In Party Identification

Gallup reports:
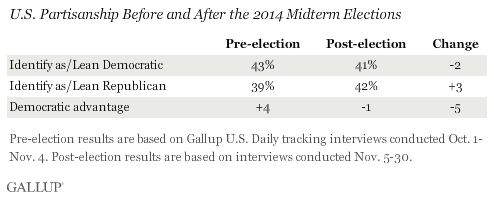
Since the Republican Party's strong showing on Election Day last month, Americans' political allegiances have shifted toward the GOP. Prior to the elections, 43% of Americans identified as Democrats or leaned toward the Democratic Party, while 39% identified as or leaned Republican. Since then, Republicans have opened up a slight advantage, 42% to 41%, representing a net shift of five percentage points in the partisanship gap.
U.S. Partisanship Before and After the 2014 Midterm Elections
The pre-election results are based on Gallup Daily tracking interviews with 17,259 U.S. adults, conducted between Oct. 1 and Nov. 4. The post-election interviews are based on 12,671 interviews conducted Nov. 5-30.

Thursday, October 30, 2014

Polls Do Not Look Good for Democrats

National polls generally look bad for the Democrats.

CBS reports on a new poll:
Republicans continue to hold a lead in the national Congressional ballot test: 47 percent of likely voters say they will support the Republican candidate in their district, while 40 percent support the Democrat.

About nine in ten Republicans, and a similar percentage of Democrats, say they support their party's candidate for the House of Representatives. Independents are supporting the Republican candidate.

Thirty-two percent of voters are paying a lot of attention to the campaign, a figure that has steadily risen since September, and is similar to the percentage who said the same four years ago.
Four in ten voters say they are more enthusiastic about voting this year compared to past elections. Forty-seven percent say they are less enthusiastic, up 13 points from the 34 percent who said that in October 2010. Republican voters (48 percent) are more likely than Democratic voters (42 percent) to say they are more enthusiastic.

Voters continue to choose the economy (38 percent) as the most important issue in their vote for Congress this year, followed by health care (23 percent and terrorism (11 percent).

Americans' party preferences during the third quarter of a midterm election year give a good indication of which party will perform better in that year's election. Democrats' narrow two-percentage-point advantage in party affiliation this year -- 45% to 43% -- shares a greater similarity with strong Republican midterm years, such as 1994, 2002 and 2010, than with the advantage held in better Democratic years like 1998 and 2006.
Democrats typically hold an advantage in party affiliation among the national adult population -- Republicans have held a slight numerical advantage in only three years since 1993. But since Republicans and Republican leaners typically vote at higher rates than Democrats and Democratic-leaning independents, the voting electorate will usually be much less Democratic than the larger adult population. Thus, if Democrats start out with only a slim advantage among all adults, the voting electorate may very well end up being more Republican than Democratic.
Pew reports:
After more than a year of inaction by Congress and President Obama on immigration reform, Democrats maintain a wide, but diminished, advantage among Hispanic registered voters, according to a new nationwide survey of 1,520 Hispanic adults, including 733 registered voters, by the Pew Research Center.
The survey also finds that for  about half of Hispanic registered voters (54%), a candidate’s position on immigration is not a deal-breaker in determining their vote if that candidate shares their views on most other issues.
Overall, 57% of Latino registered voters support the Democratic candidate in their congressional district or lean Democratic, while 28% favor the Republican candidate or lean Republican, a greater than two-to-one advantage for Democrats. But support for congressional Democrats is down from 2010, when 65% of Latino registered voters backed the Democrat in their congressional district and 22% favored the Republican candidate (Lopez, 2010).
The survey reveals in other ways that Latino registered voters are somewhat less supportive of the Democratic Party now than in recent years. On political party identification, 63% today say they identify with or lean toward the Democratic Party, down from 70% who said the same in 2012. And when asked which political party has more concern for Latinos, 50% say the Democrats, down from 61% who said the same in 2012.
Meanwhile, Republicans have made some progress among Hispanic voters. About one-quarter (27%) today say they identify with or lean toward the Republican Party. In 2012, 22% said the same.

A release from the Kennedy School's Institute of Politics:
A new national poll of America’s 18- to 29- year-olds by Harvard’s Institute of Politics (IOP), located at the John F. Kennedy School of Government, finds slightly more than
half (51%) of young Americans who say they will “definitely be voting” in November prefer a Republican-run Congress with 47 percent favoring Democrat control – a significant departure from IOP polling findings before the last midterm elections (Sept. 2010 – 55%: prefer Democrat  control; 43%: prefer Republican control). The cohort – 26% of whom report they will “definitely” vote in the midterms – appear up-for-grabs to both political parties and could be a critical swing vote in many races in November

Friday, August 1, 2014

Party Identification Looks Good for GOP

Gallup reports:
An average of 42% of Americans currently identify as Democrats or say they are independent but lean to the Democratic Party. Slightly fewer, 40%, are Republicans or Republican leaners. That narrow two-percentage-point Democratic edge is closer to what Gallup measured in the third quarter of strong Republican midterm years such as 1994, 2002, and 2010 than in the strong Democratic years of 1998 and 2006.
...
Democrats currently have a narrow advantage in terms of Americans' identification with the two major parties, but based on historical turnout and other structural patterns, this small advantage suggests that the Democrats face a tough election environment this year. As Gallup demonstrated earlier this summer, President Obama's below-average job approval rating and Americans' low level of satisfaction with the way things are going in the country are also ominous signs for the Democrats. Historically, these indicators are unlikely to change in a short period of time such as the three months between now and Election Day.
With Democrats' advantage in partisanship currently consistent with where it has been in previous strong GOP midterm election years, it is imperative that Democrats match or exceed Republican turnout this fall if they hope to keep control of the Senate and minimize the size of the Republican majority in the House.